ShmoopTube
Where Monty Python meets your 10th grade teacher.
Search Thousands of Shmoop Videos
Playlist ACT® Science Data Representation 25 videos
ACT Science: Data Representation Passage Drill 1, Problem 1. What do the statistics in Figure 1 suggest?
ACT Science: Data Representation Passage Drill 1, Problem 2. Which of the following is a variable in Figure 1, but not in Figure 2?
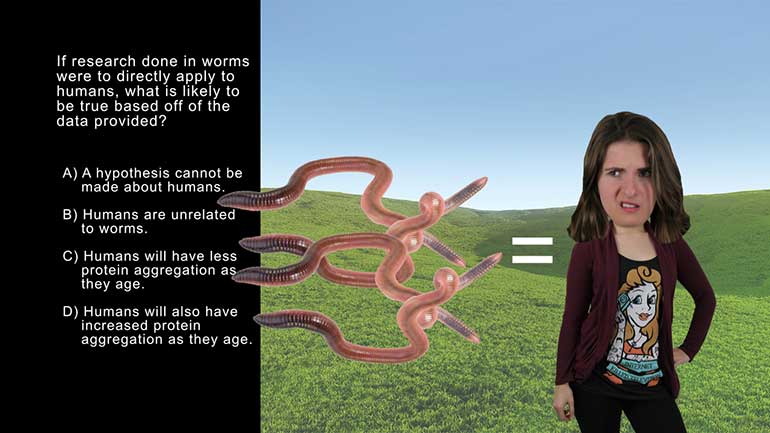
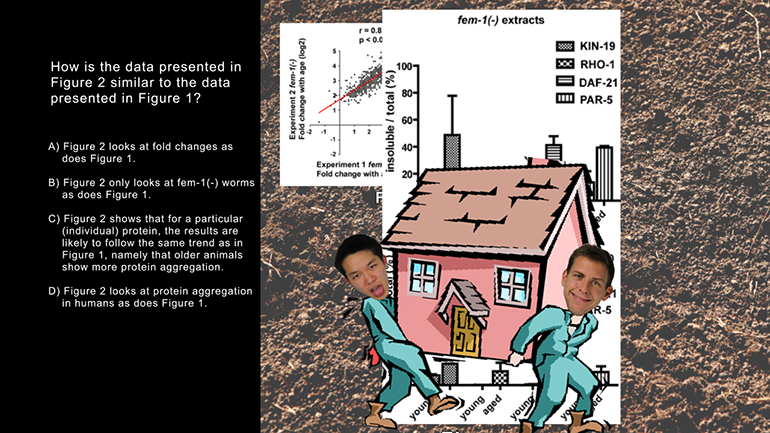
ACT Science: Data Representation Passage Drill 2, Problem 10. If research done in worms were to directly apply to humans, what is likely to be...
ACT Science 2.4 Data Representation Passage 208 Views
Share It!
Description:
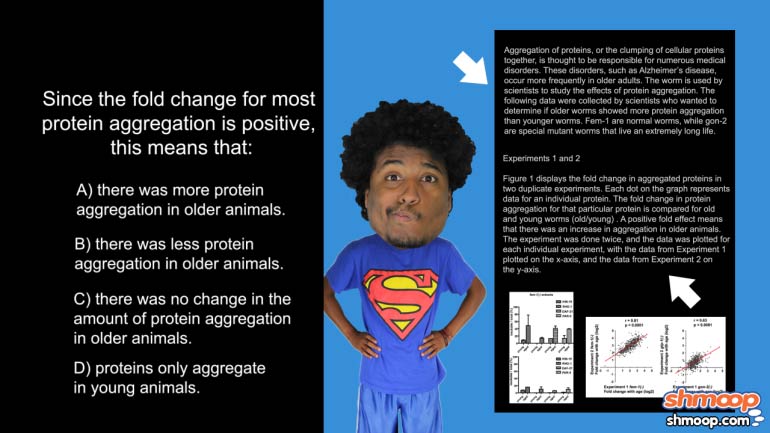
ACT Science: Data Representation Passage Drill 2, Problem 4. Since the fold change for most protein aggregation is positive, this means that...what?
Transcript
- 00:03
Here’s your shmoop du jour, brought to you by young animals.
- 00:07
Most of them will probably go through a brief wild animal phase,
- 00:10
but after that they should settle down.
- 00:24
Since the fold change for most protein aggregation is positive, this means that:
- 00:31
And here are the potential answers…
Full Transcript
- 00:33
Ok, here we go. This is a SUPER straightforward question.
- 00:37
The key part to this question is that you’ve read the small text passages next to the graphs.
- 00:44
In the second paragraph, the text says that "a positive fold effect means that there was
- 00:49
an increase in aggregation in older animals."
- 00:52
Well, couldn't be any plainer.
- 00:53
It's practically word for word the same as our first answer choice.
- 00:57
Meaning we can spare ourself the anguish of laboring over the others.
- 01:00
And the correct answer is A!
- 01:02
Alright, now if someone give that giraffe a ride home, that'd be great.
Related Videos
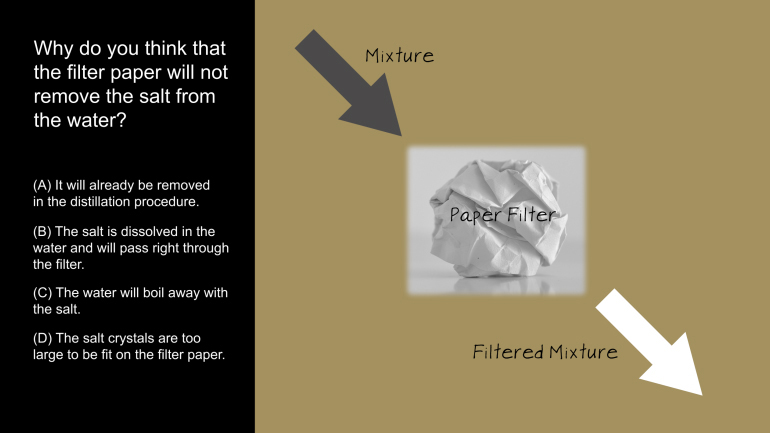
ACT Science: Research Summary Passage Drill 2, Problem 1. Why do you think that the filter paper will not remove the salt from the water?
ACT Science: Conflicting Viewpoint Passage Drill 1, Problem 1. What statement would both scientists agree upon?
ACT Science: Data Representation Passage Drill 1, Problem 1. What do the statistics in Figure 1 suggest?
ACT Science: Data Representation Passage Drill 1, Problem 2. Which of the following is a variable in Figure 1, but not in Figure 2?
ACT Science Data Representation Passage: Drill 3, Problem 5. According to Figure 2, what birth date will be predicted for an individual actual...


