ShmoopTube
Where Monty Python meets your 10th grade teacher.
Search Thousands of Shmoop Videos
Exploring Data Videos 25 videos
AP Statistics: Exploring Data Drill 1, Problem 2. Which of the following is the best way to display this type of data?
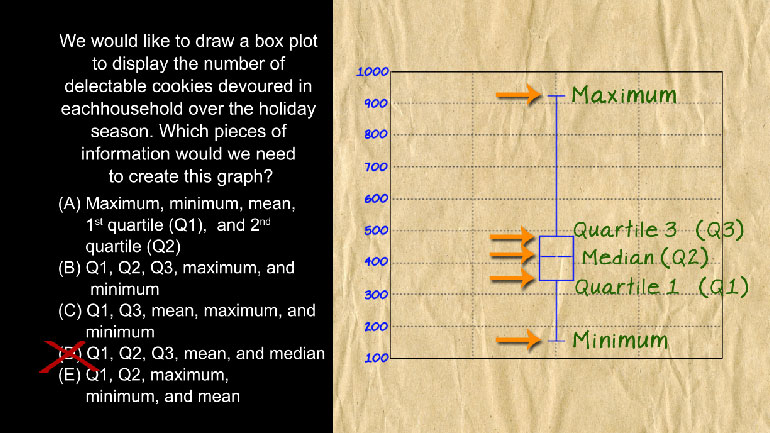
AP Statistics: Exploring Data Drill 1, Problem 5. Which pieces of information would we need to create this graph?
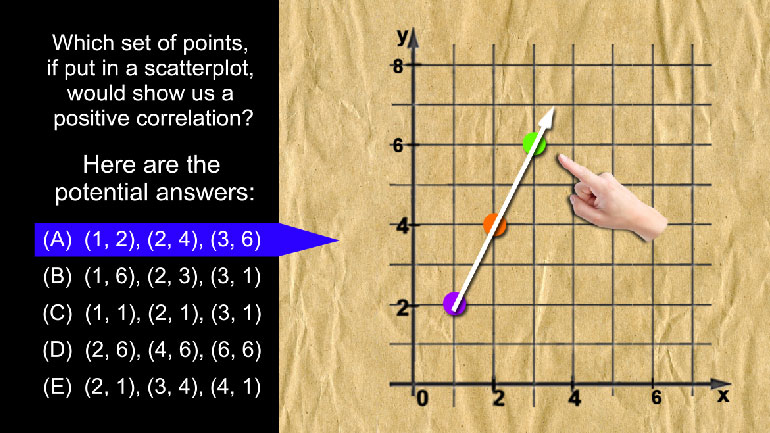
AP Statistics: Exploring Data Drill 2, Problem 3. Which set of points, if put in a scatterplot, would show us a positive correlation?
AP Statistics 4.2 Exploring Data 185 Views
Share It!
Description:
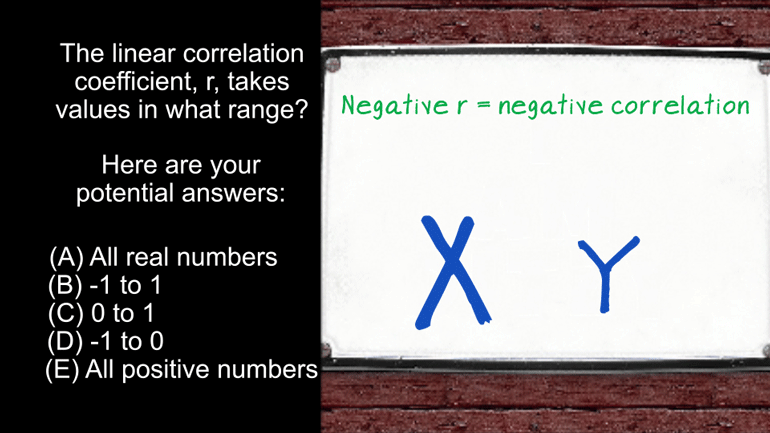
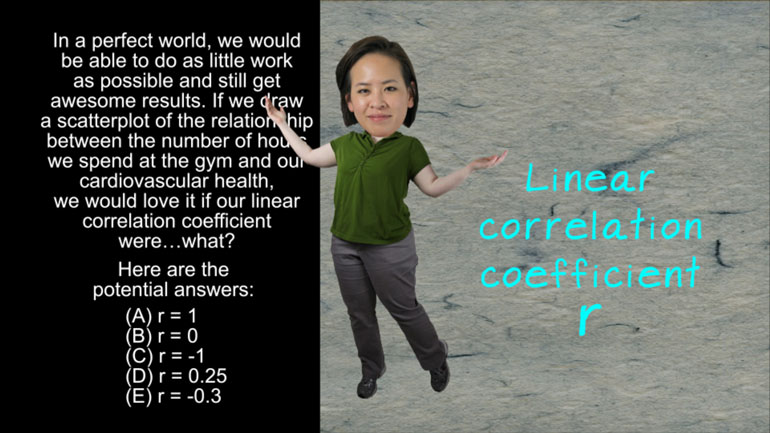
AP Statistics 4.2 Exploring Data. The linear correlation coefficient r, takes values in what range?
Transcript
- 00:00
Thank you We sneak and here's your smoke du jour
- 00:05
brought to you by the letter r which clearly stands
- 00:08
for linear correlation coefficient Because there's got to be an
- 00:13
r in there somewhere All right Linear correlation coefficient are
- 00:17
tanks Values in what range And hear the potential answers
Full Transcript
- 00:21
All right what is our people Okay what do we
- 00:24
know about linear correlation Coefficient What we should know is
- 00:28
that the value of the coefficient can show us how
- 00:30
close the relationship is to a linear one that is
- 00:34
a positive Our means that as x increases so does
- 00:38
why while the negative art tells us that as x
- 00:41
increases why decreased Well since both could be the case
- 00:46
we must be able to have a mix of some
- 00:47
positive in some negative numbers which knots out option c
- 00:51
d and e the only decision now is whether coefficients
- 00:54
can be any real number or if they're limited to
- 00:58
being between one and negative one And because in all
- 01:01
our days we've never seen an r value higher than
- 01:04
one or lower than negative one Well we're going to
- 01:06
assume it's the latter but the answer is b that's
- 01:10
B is in light bulbs Hey if arkan do it 00:01:13.689 --> [endTime] can't be
Related Videos
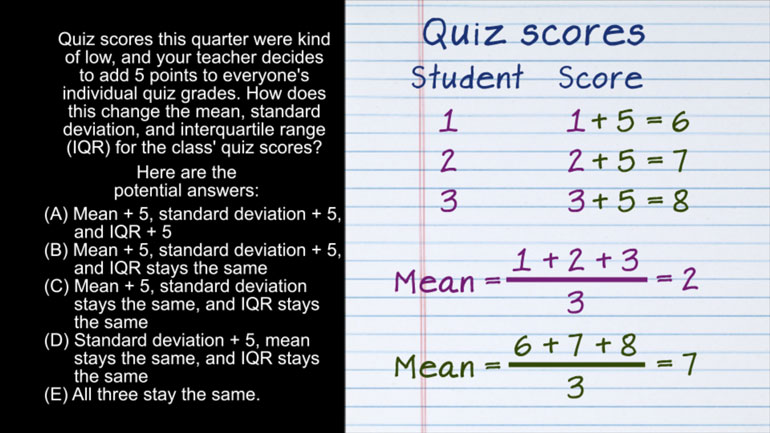
AP Statistics 2.1 Exploring Data. How does this change affect the mean, standard deviation, and IQR?
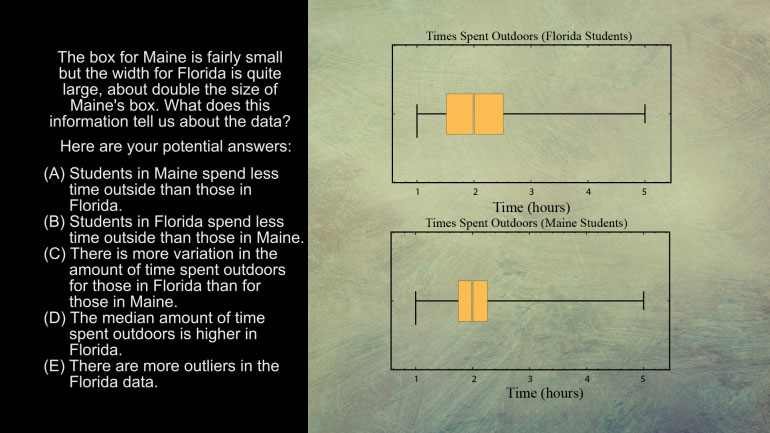
AP Statistics 5.1 Exploring Data. What does this information tell us about the data?
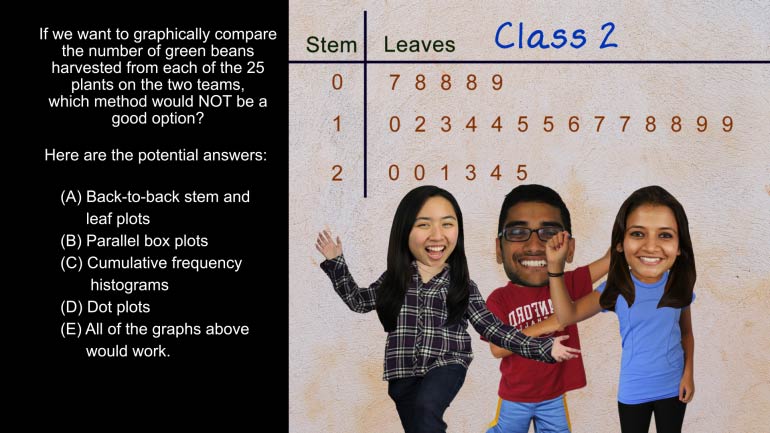
AP Statistics 5.2 Exploring Data. Which method would not be a good option?
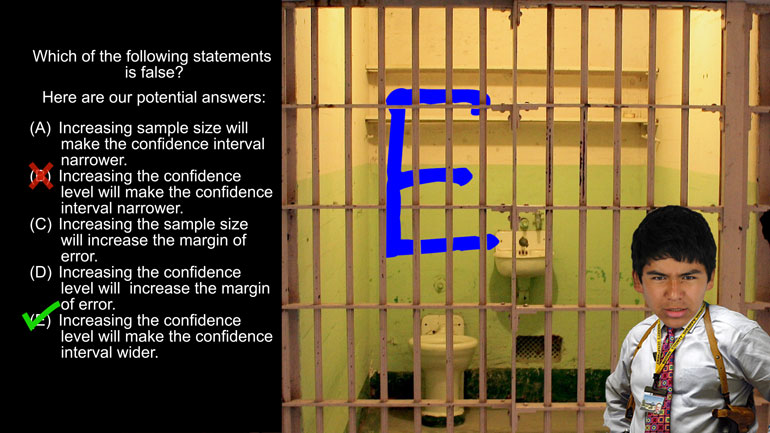
AP Statistics 1.5 Statistical Inference. Which of the following statements is false?
Want to pull an Oliver Twist and ask us for more? We've gotcha covered. Head over to /video/subjects/math/test-prep/ap-statistics/ for more AP...

