ShmoopTube
Where Monty Python meets your 10th grade teacher.
Search Thousands of Shmoop Videos
AP Statistics Videos 40 videos
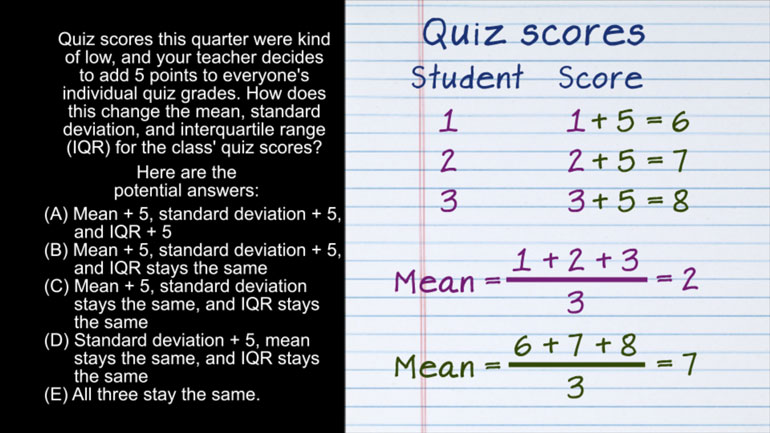
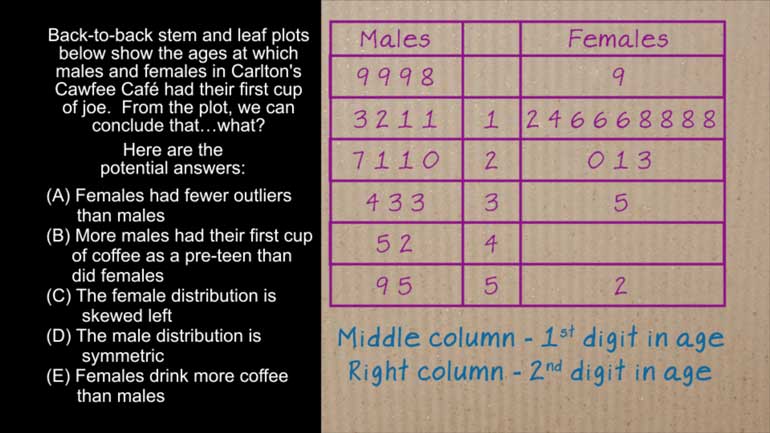
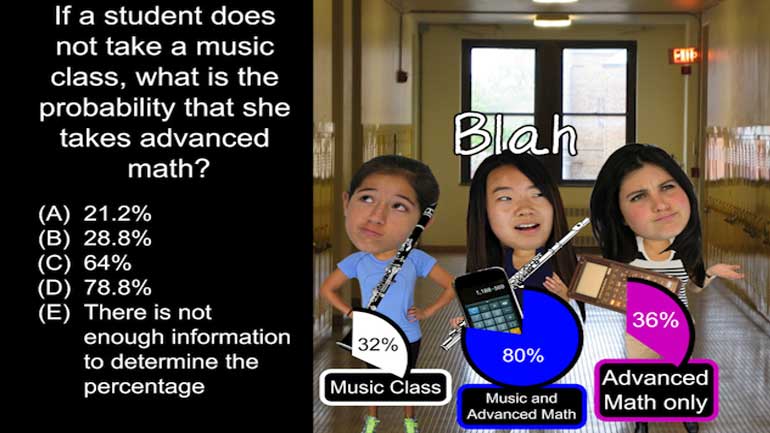
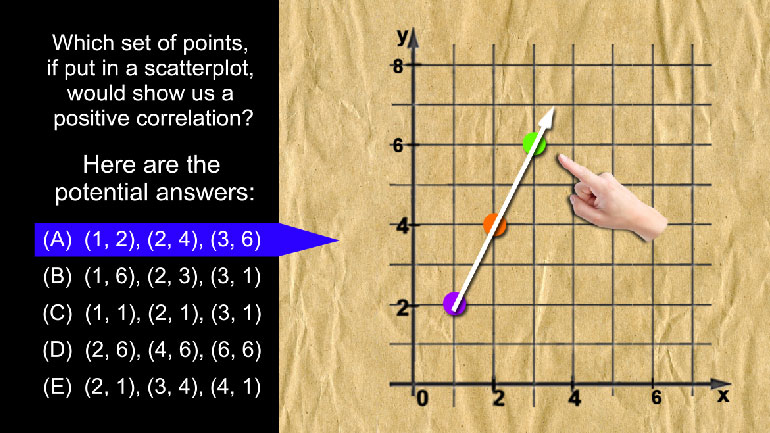
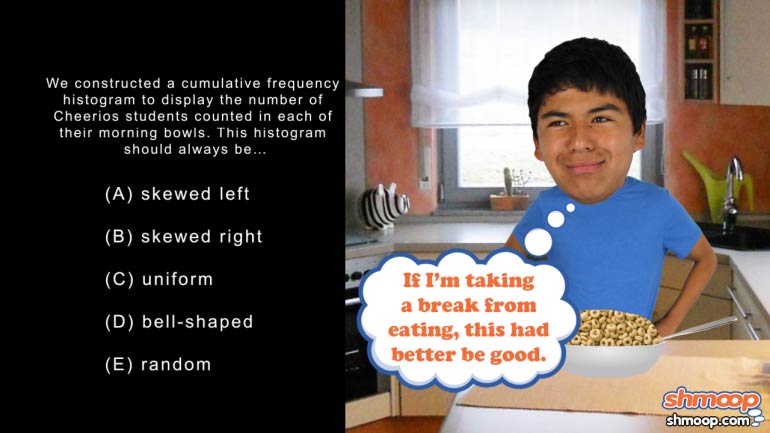
AP Statistics 2.1 Exploring Data. How does this change affect the mean, standard deviation, and IQR?
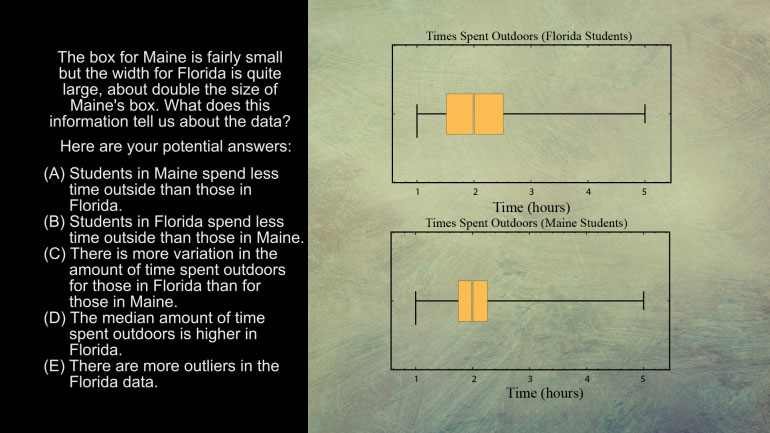
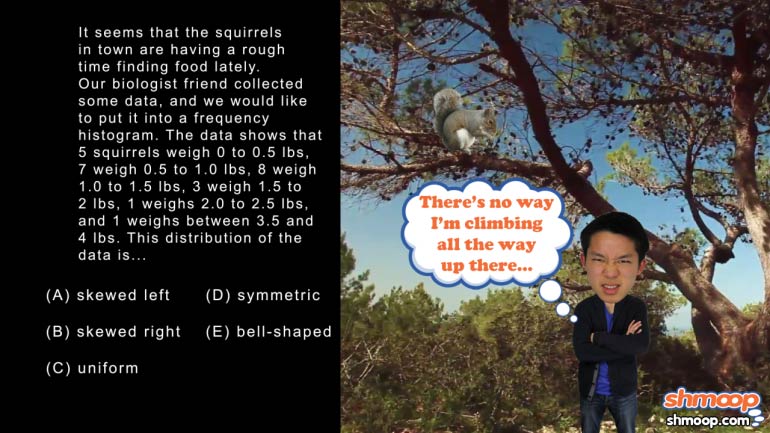
AP Statistics 5.1 Exploring Data. What does this information tell us about the data?
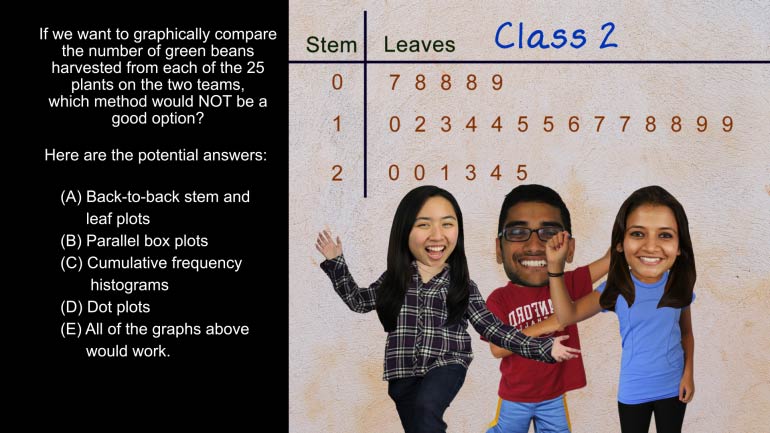
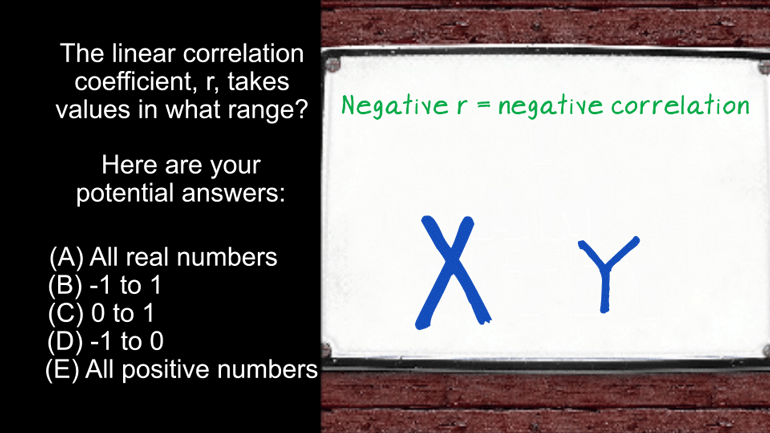
AP Statistics 5.2 Exploring Data. Which method would not be a good option?
AP Statistics 3.1 Statistical Inference 7 Views
Share It!
Description:
AP Statistics 3.1 Statistical Inference. Based on the numbers given, which of the following statements is true?
Transcript
- 00:04
And here's your shmoop du jour brought to you by Halloween the
- 00:07
day designated for handing out miniature candy bars unidentifiable chewy things [Girl handing out treats to children trick or treating]
- 00:12
and home baked stuffed with burn marks on the bottom..an apples..Alright 31
- 00:19
out of 75 high school students planned on trick-or-treating based on the
- 00:23
numbers given which of the following statements is true if we calculate a
Full Transcript
- 00:26
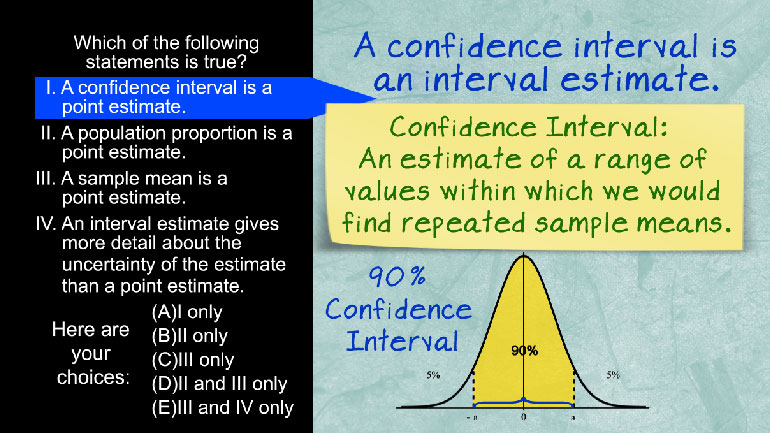
confidence interval with a confidence level of ninety percent all right here are
- 00:30
the potential answers....Okay well ever wonder why no one ever dresses up as a [People dressed up together in a park]
- 00:38
statistician on Halloween? Well probably because they would spend most
- 00:42
of their time calculating the true proportion of edible versus inedible [Statisticians performing calculations]
- 00:46
nevermind, okay on to the problem we go let's do the math based on 31 who are
- 00:51
going trick-or-treating out of our sample of 75 we also need to consider [children running out of a classroom to trick or treat]
- 00:55
the 44 out of the 75 who have decided to take no part in the tp'ing and/or egging
- 01:00
of houses using the numbers we have to calculate our formula the ninety percent [formula of the confidence interval]
- 01:05
confidence level indicates a plus minus nine point three six percent while the
- 01:11
true population proportion of trick-or-treaters is between 31.97
- 01:16
percent and 50.69 percent the only one of the possible answers
- 01:21
that matches that description is answer C, right there. If you answered correctly
- 01:25
you can expect a two-foot-long gummy worm in your Halloween goody bag this [Little girl in a halloween costume holding a goody bag]
- 01:29
year, just make sure it's actually a gummy if it tries to crawl back out of your mouth
- 01:33
well you may want to avoid that house in future years[children screaming out trick or treating]
Related Videos
AP Statistics 2.1 Exploring Data. How does this change affect the mean, standard deviation, and IQR?
AP Statistics 5.1 Exploring Data. What does this information tell us about the data?
AP Statistics 5.2 Exploring Data. Which method would not be a good option?
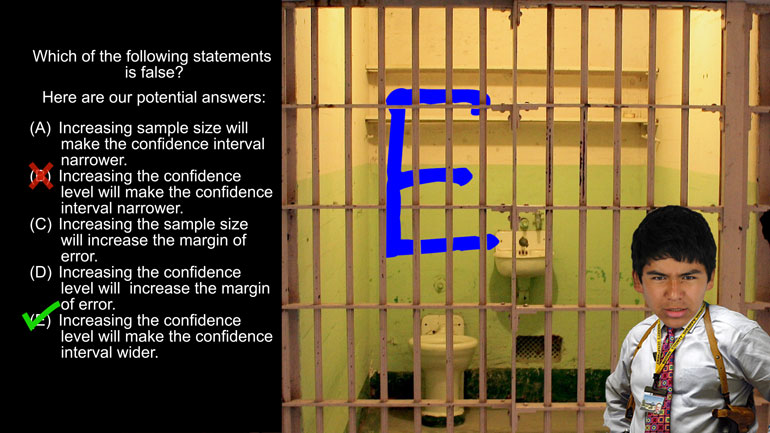
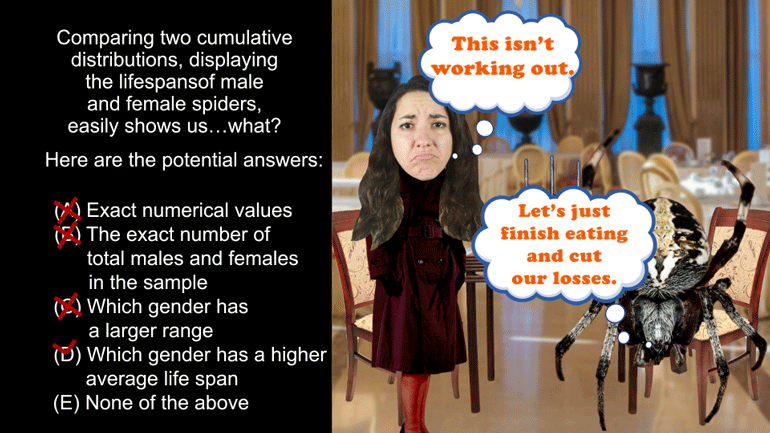
AP Statistics 1.5 Statistical Inference. Which of the following statements is false?
Want to pull an Oliver Twist and ask us for more? We've gotcha covered. Head over to /video/subjects/math/test-prep/ap-statistics/ for more AP...
