ShmoopTube
Where Monty Python meets your 10th grade teacher.
Search Thousands of Shmoop Videos
Problem Solving and Data Analysis Videos 50 videos
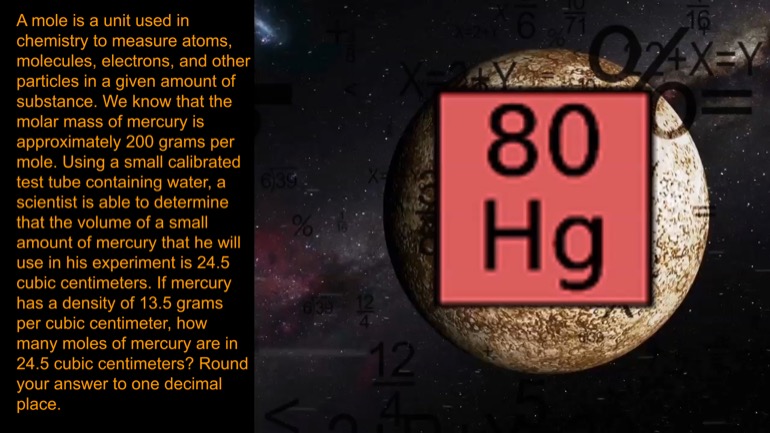
A mole is a unit used in chemistry to measure atoms, molecules, electrons, and other particles in a given amount of substance. We know that the mol...
The table above estimates the population increase of a colony of bacteria over the course of five years. Which of the following best characterizes...
Employees of a candy company surveyed people of different ages and asked them their favorite flavor of candy. One of the surveyors chooses to send...
Identifying Exponential Patterns in a Data Set 4 Views
Share It!
Description:
The table above estimates the population increase of a colony of bacteria over the course of five years. Which of the following best characterizes the model for this colony's total population over time?
Transcript
- 00:00
Yeah Whoa Okay It's a team match Members last in
- 00:05
this series We're looking at a chart here years and
- 00:09
I need anyone thing a population increase Wow They're growing
- 00:13
pretty fast there Well the table above shows the yearly
- 00:15
population increase of a country that clearly has no birth
Full Transcript
- 00:18
control Which of the following best characterizes the model for
- 00:22
this country's total population over time Well let's think about
- 00:29
this This country was unpopular to start so there were
- 00:33
zero people there Then the population increase of five million
- 00:36
in nineteen ninety like everyone migrated there gave the country
- 00:40
five million more people The next year they were ten
- 00:43
million more people so a total of fifteen million gained
- 00:46
so far My goodness that's a big oppel Population increase
- 00:50
goes like five ten fifteen twenty twenty five Total population
- 00:54
is five fifteen thirty fifty seventy five Kind of taking
- 00:57
a little bit so the total population is exponentially increasing
- 01:02
But that's not quite exponentially interesting but at least we're
- 01:05
through with this problem So yeah the answer is a 00:01:08.49 --> [endTime] exponential growth
Related Videos
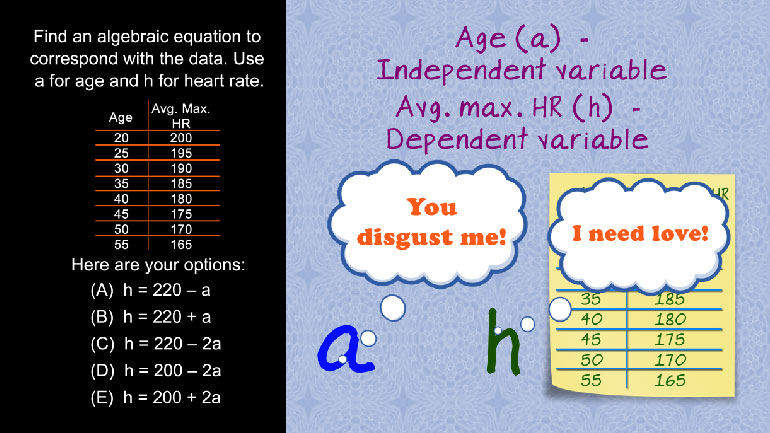
SAT Math 1.1 Algebra and Functions. Find an algebraic equation to correspond with the data.
SAT Math 1.1 Geometry and Measurement. What is the circumference of the circle?
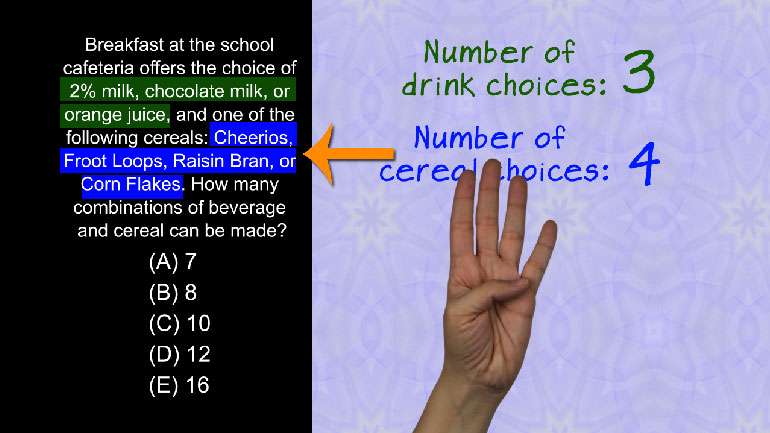
SAT Math 1.1 Numbers and Operations. How many combinations of beverage and cereal can be made?
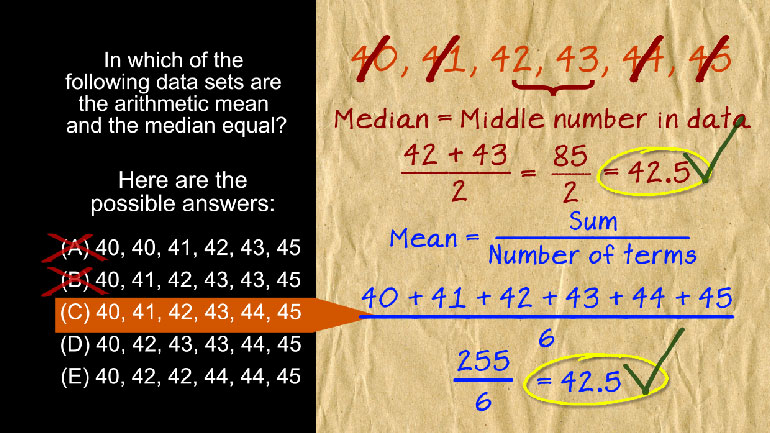
SAT Math 1.1 Statistics and Probability. In which of the following data sets are the arithmetic mean and the median equal?
SAT Math: Algebra and Functions Drill 1, Problem 2. Based on the data in the table, what is the maximum heart rate for the average 22-year-old?
